
 rises above alt=")
Dogecoin started a new rally from the $0.0950 zone against the US dollar. DOGE currently faces a hurdle near $0.1075, which could push it higher.
DOGE price started a decent rise above $0.100 and $0.1050. The price is trading above the $0.1040 level and the 100 hourly simple moving average. On the hourly chart of the DOGE/USD pair, a major bullish trend line is forming with support at $0.1020 (data source: Kraken). If it remains above $0.10, the price is likely to continue rising.
Dogecoin price rises above hurdle
Dogecoin price remains supported above the $0.0965 zone and begins a new rally, outpacing Bitcoin and Ethereum. DOGE has broken above the $0.0985 and $0.10 resistance levels.
The price rose more than 8% and tested the $0.1120 zone. It has significantly corrected some of its gains and revisited $0.1009. The bulls continued their action and pushed the price back above $0.1050. There was a move above the 50% Fib retracement level of the decline from the swing high of $0.1120 to the low of $0.1009.
Dogecoin price is currently trading above the $0.1050 level and the 100-hour simple moving average. Additionally, there is an important bullish trend line forming with support at $0.1020 on the hourly chart of the DOGE/USD pair.
If the bulls remain active, the price could try to move higher. Immediate upside resistance lies near the $0.1075 level, or the 61.8% fibritracement level of the decline from the swing high of $0.1120 to the low of $0.1009.
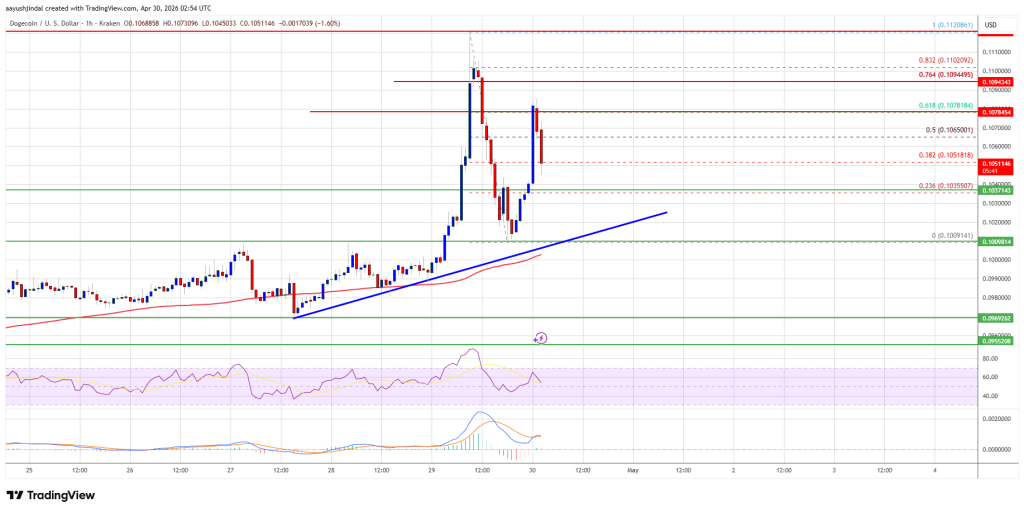
The first major resistance for the bulls could be around the $0.1095 level. The next major resistance level is near the $0.1120 level. If the closing price breaks above the $0.1120 resistance, the price could head towards the $0.1150 resistance. Further upside could send the price towards the $0.120 level. The next major stop for the bulls could be at $0.1250.
Another decline in DOGE?
If DOGE price fails to break above the $0.1075 level, the decline may continue. Downside support is near $0.1035. The next major support is near the $0.1020 level.
The major support is located at $0.10. If the price breaks below the $0.10 support, the price may fall further. In the above case, the price may fall towards the $0.0955 level and even $0.0950 in the short term.
technical indicators
Hourly MACD – The MACD for DOGE/USD is currently gaining momentum in the bullish zone.
Hourly RSI (Relative Strength Index) – The RSI for DOGE/USD is currently above the 50 level.
Major support levels – $0.1035 and $0.1020.
Key resistance levels – $0.1075 and $0.1120.