

Cryptocurrency analyst VisionPulsed argues that Dogecoin’s next inflection period could arrive as early as October 22-23, with the memecoin’s multi-month upward channel confirming a low in the $0.16-$0.18 region or giving way to a full “round trip” by the end of the year.
In an Oct. 16 video analysis, he frames next week as a binary checkpoint: “Next week is do or die…If this falls apart, it's over. GG. If it holds up, then we can say, 'Okay, here comes the rally, maybe we'll get another chance.'”
Why October 23rd is important for Dogecoin
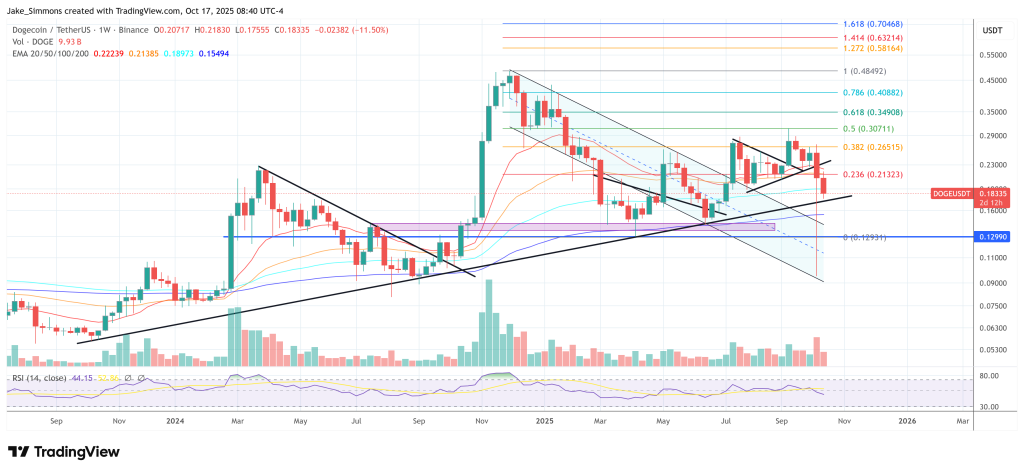
The case is based on a recurring confluence that he has been tracking for several months. With the daily RSI nearing oversold, Dogecoin tagged the channel support trendline, followed by an improvement in the macro reading on M2, turning bullish at the end of the month.
Related books
“Every time we hit the trend line, the RSI reaches oversold,” he said, pointing to previous tests in March-April and June. “We just hit the trend line again in October…and M2 turns bullish at the end of October.” He stopped short of calling it a “bullish development,” describing the next attempt to move higher as a “bullish push” contingent on holding that support until October 23.
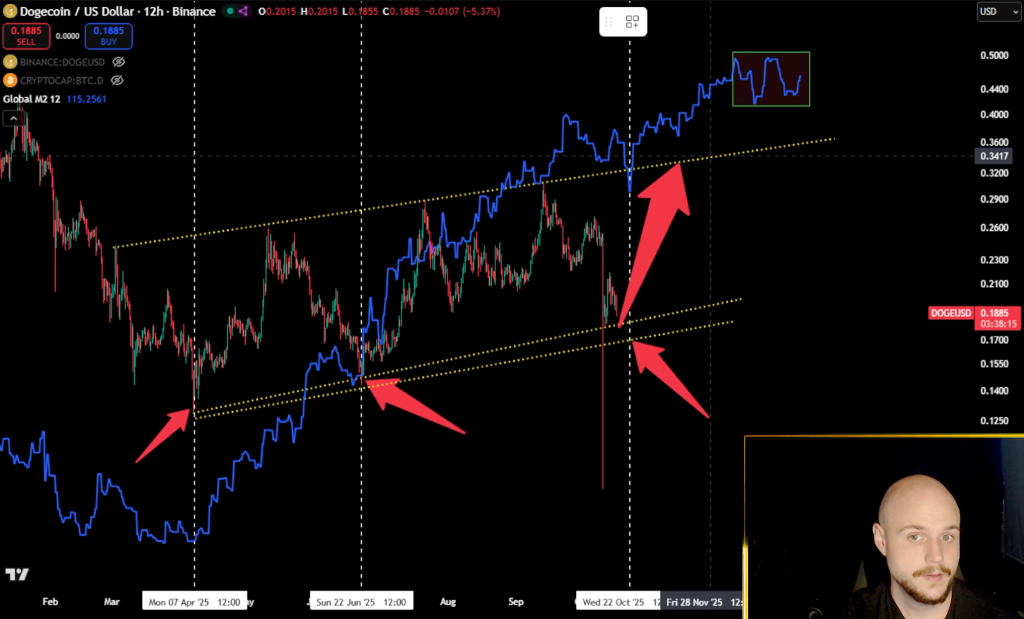
VisionPulsed places an unusual emphasis on timing. He sees confirmation if Dogecoin sets an even higher low between October 22nd and 23rd, and accurate price reading is less important than maintaining structure. “Even if we end up with a higher low, technically it could be 18 cents or 16 cents… but that doesn't matter. We will hold the trend line,” he said. If that doesn't happen, he sees a permanent reversal being pushed over the horizon. “If we crash in November anyway, we're not going to go up. It's simple. We're running out of time.”
Seasonality and emotion are important in his diagnosis. He argues that October was a continuing headwind for Dogecoin and broader risks, with November often being an inflection point. “October is not that bullish…The S&P 500 is bearish in October,” he noted. “In fact, November is historically when the market turns bullish.”
Week-to-week fluctuations through the middle of the year, he argues, emphasize the point: “In June, it's gone, and in July, it's back. And in August, it's gone. And in September, it's back again. In October, it's gone. And by November, it's probably back.”
Still, this analysis is framed around a frank acknowledgment of Dogecoin's stalled cycle. “We've been making Dogecoin videos for almost two years…it's been two years now and the price hasn't helped anything,” he said. “Three years ago, Dogecoin was 16 cents, now it’s 18 cents…Dogecoin price hasn’t moved in almost three years.”
Related books
This stagnation is why he sees the fourth year of the four-year cycle as the deciding factor. If this channel fails, or conversely if the market recovers but fails to break out by December, he expects further “back and forth”. “If we make it to December and still can't break out of the channel, we will become bearish again and go back and forth again.”
Tactically, we expect the pair to test support once again heading into the weekend before attempting a reversal. “We'll probably do some backtesting this weekend. We'll probably see another drop,” he said. “If we can form a higher low, the bottom could be confirmed and the reversal could be even higher.”
With unusual clarity, he identified a key checkpoint on October 23, saying “X marks that point” and insisting that until then “we are bearish.” If support holds, the upward roadmap would be for a return to the top of the channel by late November, consistent with the monthly recovery to date. “I wouldn’t be surprised if we were back at the top of the channel by the end of November.”
“It won’t take long for Dogecoin to actually recover,” he concluded, emphasizing the coin’s ability to enable rapid mean-value recoveries once the structure is respected. “But before we start talking about reversal points, we first need to sustain the bottom of the channel.”
At the time of writing, DOGE was trading at $0.183.
Featured image created with DALL.E, chart on TradingView.com