

Bitcoin price failed to rise above $68,800 and further decline began. BTC is currently trading below $67,500, and losses could widen in the short term.
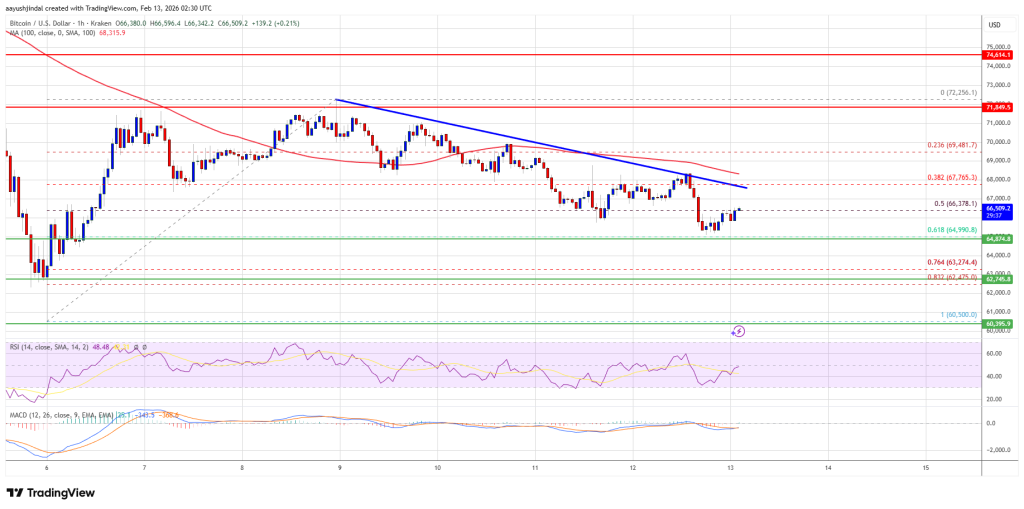
Bitcoin is slowly falling below $68,000 and $67,500. The price is trading below the 100 hourly simple moving average at $67,000. The hourly chart of the BTC/USD pair (data feed from Kraken) has a bearish trendline forming resistance at $67,500. The pair could fall again if it trades below the $66,000 and $65,000 levels.
Bitcoin price falls further
Bitcoin price failed to remain stable above the $68,800 zone. BTC started a new decline, trading below the $68,000 support zone. There was also a push below $67,000.
Price fell below the 50% Fib retracement level of the bull market from the swing low of $60,500 to the high of $72,255. The bears pushed the price below $65,500. Additionally, a bearish trend line has formed on the hourly chart of the BTC/USD pair with resistance at $67,500.
Bitcoin is currently trading below $67,000 and its 100-hour simple moving average. If the price remains stable above $65,000, it may attempt a new rally. Immediate resistance is near the $67,500 level and trend line.
The first major resistance level is near the $68,000 level. If the price closes above the $68,000 resistance, the price could move higher. In the above case, the price could rise and test the $69,200 resistance. Further upside could push the price closer to the $70,500 level. The next hurdles for the bulls could be $72,000 and $72,500.
Further losses for BTC?
If Bitcoin fails to rise above the $68,000 resistance zone, further declines could begin. Immediate support is near the $65,500 level. The first major support is near the $65,000 level, or the 61.8% Fib retracement level of the swing low of $60,500 to the high of $72,255.
The next support is currently located near the $62,750 zone. Any further losses could send the price towards the $61,200 support in the near term. The main support is currently at $60,500, below which BTC may struggle to recover in the short term.
Technical indicators:
Hourly MACD – The MACD is currently pacing in the bearish zone.
Hourly RSI (Relative Strength Index) – BTC/USD’s RSI is currently below the 50 level.
Major support level – $66,000, then $65,000.
Key resistance levels – $67,500 and $68,000.