
 rebound stumbles, opening door to further decline")
Dogecoin has started a recovery wave by crossing the $0.10 zone against the US dollar. DOGE currently faces a hurdle around $0.1065 and may find it difficult to continue higher.
DOGE price started a recovery wave from $0.095 and crossed $0.10. The price is trading below the $0.110 level and the 100 hourly simple moving average. On the hourly chart of the DOGE/USD pair, the pair broke above the bearish trend line with resistance at $0.1060 (data source: Kraken). If it remains above $0.10, the price is likely to continue rising.
Dogecoin price encounters resistance
Dogecoin price started a recovery wave from the $0.0950 zone and outperformed Bitcoin and Ethereum. DOGE has broken above the $0.10 and $0.1050 resistance levels.
There was a decent up move above the 23.6% Fib retracement level of the down move from the swing high of $0.1185 to the low of $0.0948. Furthermore, on the hourly chart of the DOGE/USD pair, the pair broke above the bearish trend line with resistance at $0.1060.
However, the bears are active around the $0.1065 level and the 50% Fib retracement level of the decline from the swing high of $0.1185 to the low of $0.0948. Dogecoin price is currently trading below the $0.1065 level and the 100-hour simple moving average.
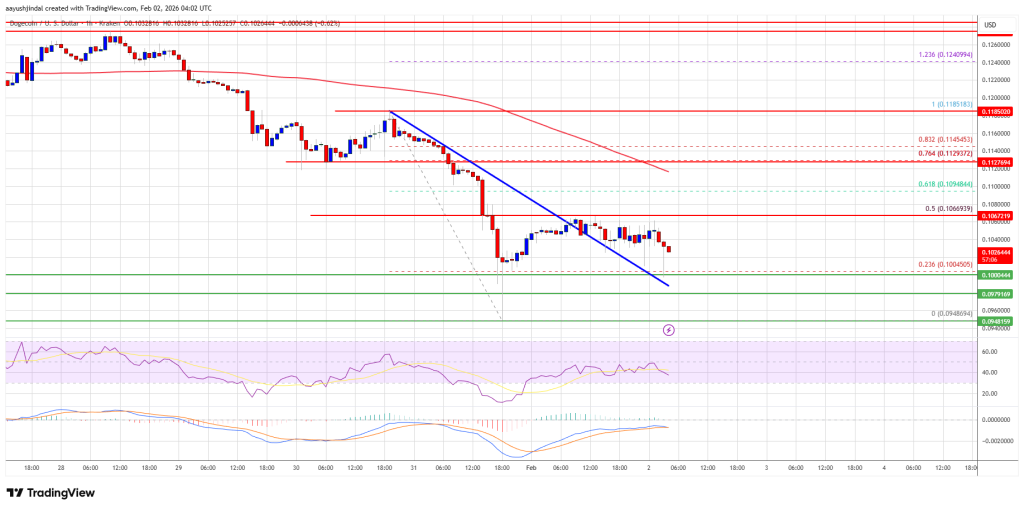
If there is another wave of recovery, the immediate resistance will be around the $0.1060 level. The first major resistance for the bulls could be around $0.1065. The next major resistance level is near the $0.1120 level. If the closing price breaks above the $0.1120 resistance, the price could head toward the $0.1185 resistance. Further upside could send the price towards the $0.120 level. The next major stop for the bulls could be at $0.1250.
Another decline in DOGE?
If DOGE price fails to break above the $0.1065 level, the decline may continue. The first support on the downside is near the $0.10 level. The next major support is near the $0.0980 level.
The main support lies at $0.0950. A downside break below the support at $0.0950 could cause the price to fall further. In the above case, the price may fall towards the $0.0880 level and even $0.0850 in the short term.
technical indicators
Hourly MACD – The MACD for DOGE/USD is currently gaining momentum in the bearish zone.
Hourly RSI (Relative Strength Index) – The RSI for DOGE/USD is currently below the 50 level.
Major support levels – $0.1000 and $0.0950.
Key resistance levels – $0.1065 and $0.1120.